
Productively managing groups of human beings who have to produce some kind of joint output was tough enough in the “before times.” Today, it’s exponentially harder, with issues compounded by the reality that many of us are working virtually, for the foreseeable future. We’re also dealing with far more in trying to get jobs done — family, illness, disruption of routines — than we’ve ever had to consider.
What we do know is that when teams can’t be together physically, the richness of the information they easily share drops dramatically. Which in turn means that you need to make a far more conscious effort to structure and manage your teams than in an in-person setting. As a team leader or team member, it’s therefore very useful to be able to get some data, quickly, on what’s going on with your teams so that any glitches can be addressed.
Start With Letting Go of Some Common Beliefs
I do find that there are a number of myths about effective teamwork that can get in the way of making sensible interventions. Hence, some beliefs we need to drop.
Myth #1: Effective teams are highly satisfied with their interpersonal relationships.
Um, nope. I mean, it is hard to work with people you detest, but you can have high degrees of respect and professionalism even if the idea of socializing with Alex from Finance gives you a headache.
Myth #2: People on effective teams don’t argue. Not true at all. People on some of the most effective teams I’ve ever seen can disagree quite heatedly. The difference is that they’re arguing about a topic, not about each other. Indeed, Ed Catmull, the creative genius who co-founded Pixar Animation Studios, emphasizes the importance of people bumping their ideas off one another and giving each other candid, if painful, feedback.
Myth #3: On effective teams, people are “nice” to each other. Not so much. As Amy Edmondson and I discussed, it’s a common misconception that in order to feel psychologically safe, you have to be a pushover. That’s a very common misunderstanding.
So How Do You Know What’s Going On With Your Team, If You’re Not Together?
Some background: My dissertation was about how existing organizations create new capabilities. One of the surprising things that I learned was that if your project teams aren’t working effectively together (a concept I called “deftness”) you can kiss your capability development efforts goodbye. Teams with issues simply couldn’t figure out how to create replicable results over time (my measure of emerging competences).
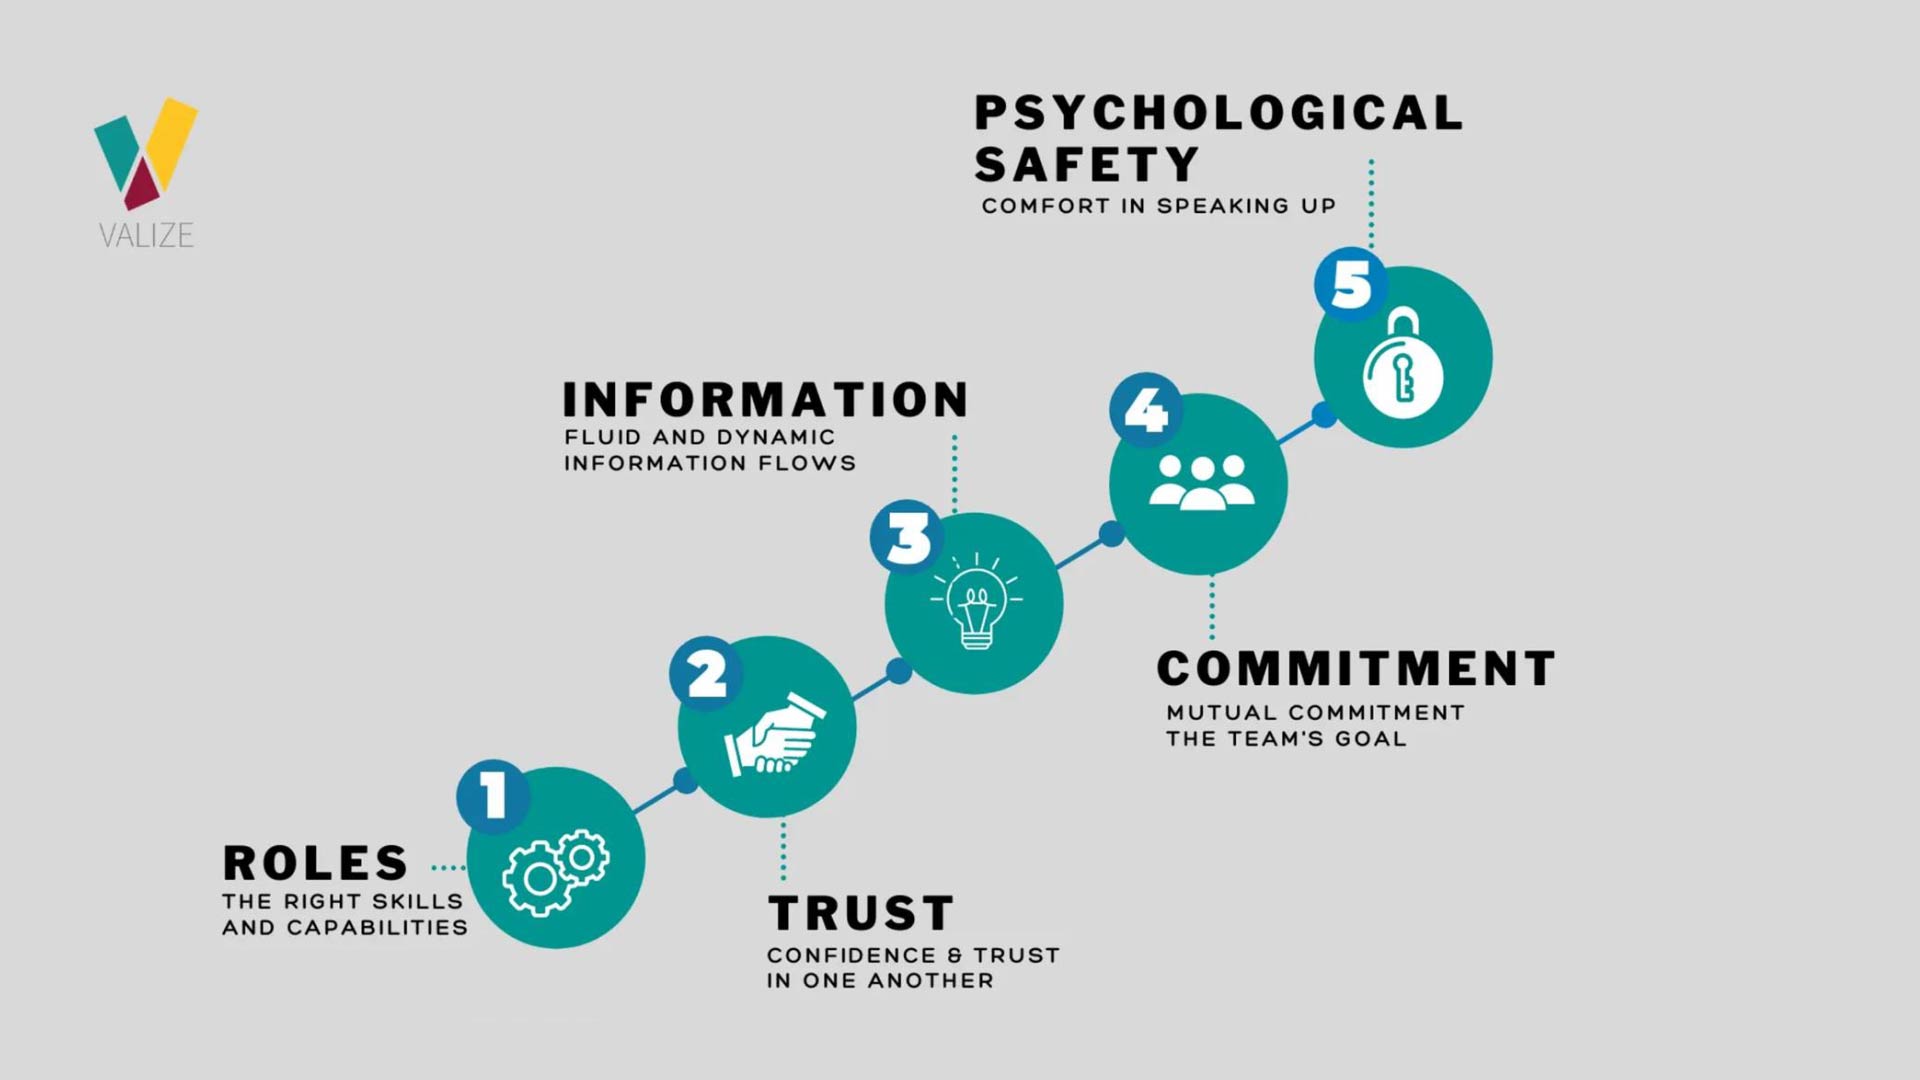
Eventually, I developed a 20-question diagnostic that I could use to quickly help project leaders and team members figure out where their team stands. These are team-level measures, so what matters is everybody’s response, not each individual response. Broadly, what I measure is evidence of the following five factors:
- Roles: The right skills and capabilities.
- Trust: Confidence and trust in one another
- Information: Fluid and dynamic information flows
- Commitment: Mutual commitment to the team’s goals
- Psychological Safety: Comfort in speaking up
The survey itself consists of 20 questions in which respondents are asked to position their team somewhere between two statements.
For an example of this survey in action, watch this video to see a demonstration of my online confidential team survey and a virtual advisory workshop and debrief with a major client.
And for more information on how you can implement this with your team, visit valize.com to view the variety of available diagnostic plans.
Sample Survey Questions
Here are the first three questions in the survey, and what low scores mean, just to get the idea:
| T01 Few of the others in the team always know what to do | 1 2 3 4 5 6 7 | All the others on the team always know what to do |
| Explanation: Low scores here imply that people are not comfortable in their roles, nor do they necessarily know what actions they are to take. This is quite normal in a new team or a team with many new members. However, if the team has been working for a while this can reflect a crippling lack of structure. | ||
| T02 Few of the others in the team are competent to do what is needed | 1 2 3 4 5 6 7 | All the others in the team are competent to do what is needed |
| Explanation: Mistrust in the collective competence of the team can lead to people feeling frustrated and withholding their best efforts, rather than see what they can perceive, as their hard work undermined by poor performance on the part of others. Low scores here can be quite debilitating to the performance of the team. | ||
| T03 Few people on the team can depend on one another to do what is needed | 1 2 3 4 5 6 7 | All people on the team can depend on one another to do what is needed |
| Explanation: Low scores here indicate that either the team members don’t know each other well enough to have established trusting relationships, or, there may be other conflicts which cause people to feel that they cannot depend on one another. This result often pops up when people are working on multiple teams and are pulled in many different directions, which can lead to others feeling they can’t be counted on. | ||
Trailing Edge Concept
For your team, what matters most is what I call the “trailing edge” — the lowest scores or highest standard deviations which would set the agenda for where you would focus on improvements. So even if the scores aren’t “low” per se, the lowest scores still represent places in which your teams could improve.
Lay Out the Data
The next step is to lay out the data so that you can begin to “see” what’s going on.
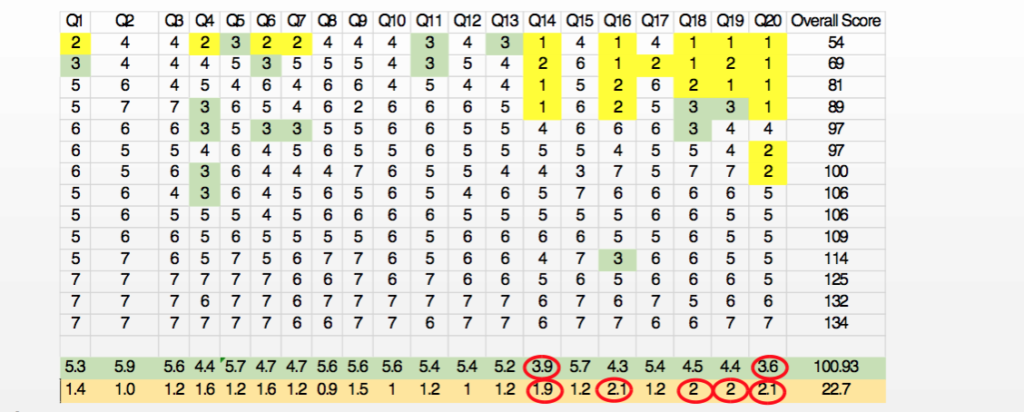
This spreadsheet would be a typical example. It has the questions across the top and the responses in the columns, sorted lowest to highest. I use two data points to look at — the average of the team’s scores and the standard deviation, which is a measure of spread. By laying the data out this way, you can instantly see that on this team, there are fairly wide deviations on some questions — for question 20, for instance, a good chunk of the team rated it very low, while a number of others gave it an extremely high score.
On the bottom, where I’ve placed the average responses and the standard deviations, I’ve circled the ones that are the lowest average and the largest standard deviation. The reason that matters is that sometimes — as in this case — even though the averages aren’t terrible, we see a real difference in point of view among different team members, differences that could bubble up into other issues.
Another way of looking at the information is to replicate the survey, and just put the averages and standard deviations on the actual survey form, then highlight the important data, like this:
| Average | Std. Dev | ||
| T01 Few of the others in the team always know what to do |
5.5 |
.55 |
All the others on the team always know what to do |
| T02 Few of the others in the team are competent to do what is needed |
6.0 |
0.00 |
All the others in the team are competent to do what is needed |
| T03 Few people on the team can depend on one another to do what is needed |
6.0 |
0.00 |
All people on the team can depend on one another to do what is needed |
Orchestrating a Team Meeting
With the data in hand, the next step is to convene a team meeting (one that is going to observe our rules from the “how to have a lousy meeting” exercise (see last month’s blog post) and commit to having an honest discussion with team members about how the team could be doing better. I’m always surprised at how often these meetings are able to resolve issues quickly, just by bringing the information to the surface.
With the automated reports, you’ll also get some pointers on what low scores may mean and what interventions you might want to deploy in the event you have them.
A typical agenda for such a meeting goes something like this:
- How to have a lousy meeting
- Theory behind the case (briefly) and how team effectiveness fits into the bigger picture
- Review of the three lowest average scores, with a round-table discussion of why we believe the scores are as they are
- Review of the three highest standard deviations (measures of difference) with a round-table discussion of why there is little agreement on those items
- Agreement on specific actions team members can take and a timeframe.
- Share notes documenting next steps
If you suspect you have a really dysfunctional team, it may make sense to bring in an outside coach or facilitator.
I’ve worked with companies who have found this exercise to be really useful, not just for one-time application but as a straightforward way of keeping up with team dynamics, even as teams morph and change as new members join, old ones leave, and the tasks before the team change.
Conclusion: Teams Are Always a Work in Progress
Unless you happen to be a hermit, you’re highly likely to be getting your work done through teams. Some are of long-standing and have built intense levels of trust and capability. Others are scattered and come together only when a particular work product beckons. Some are great. Some are like a prison sentence. Whatever the nature of the teams you are part of, working on the team can be just as important as getting the team’s work done.